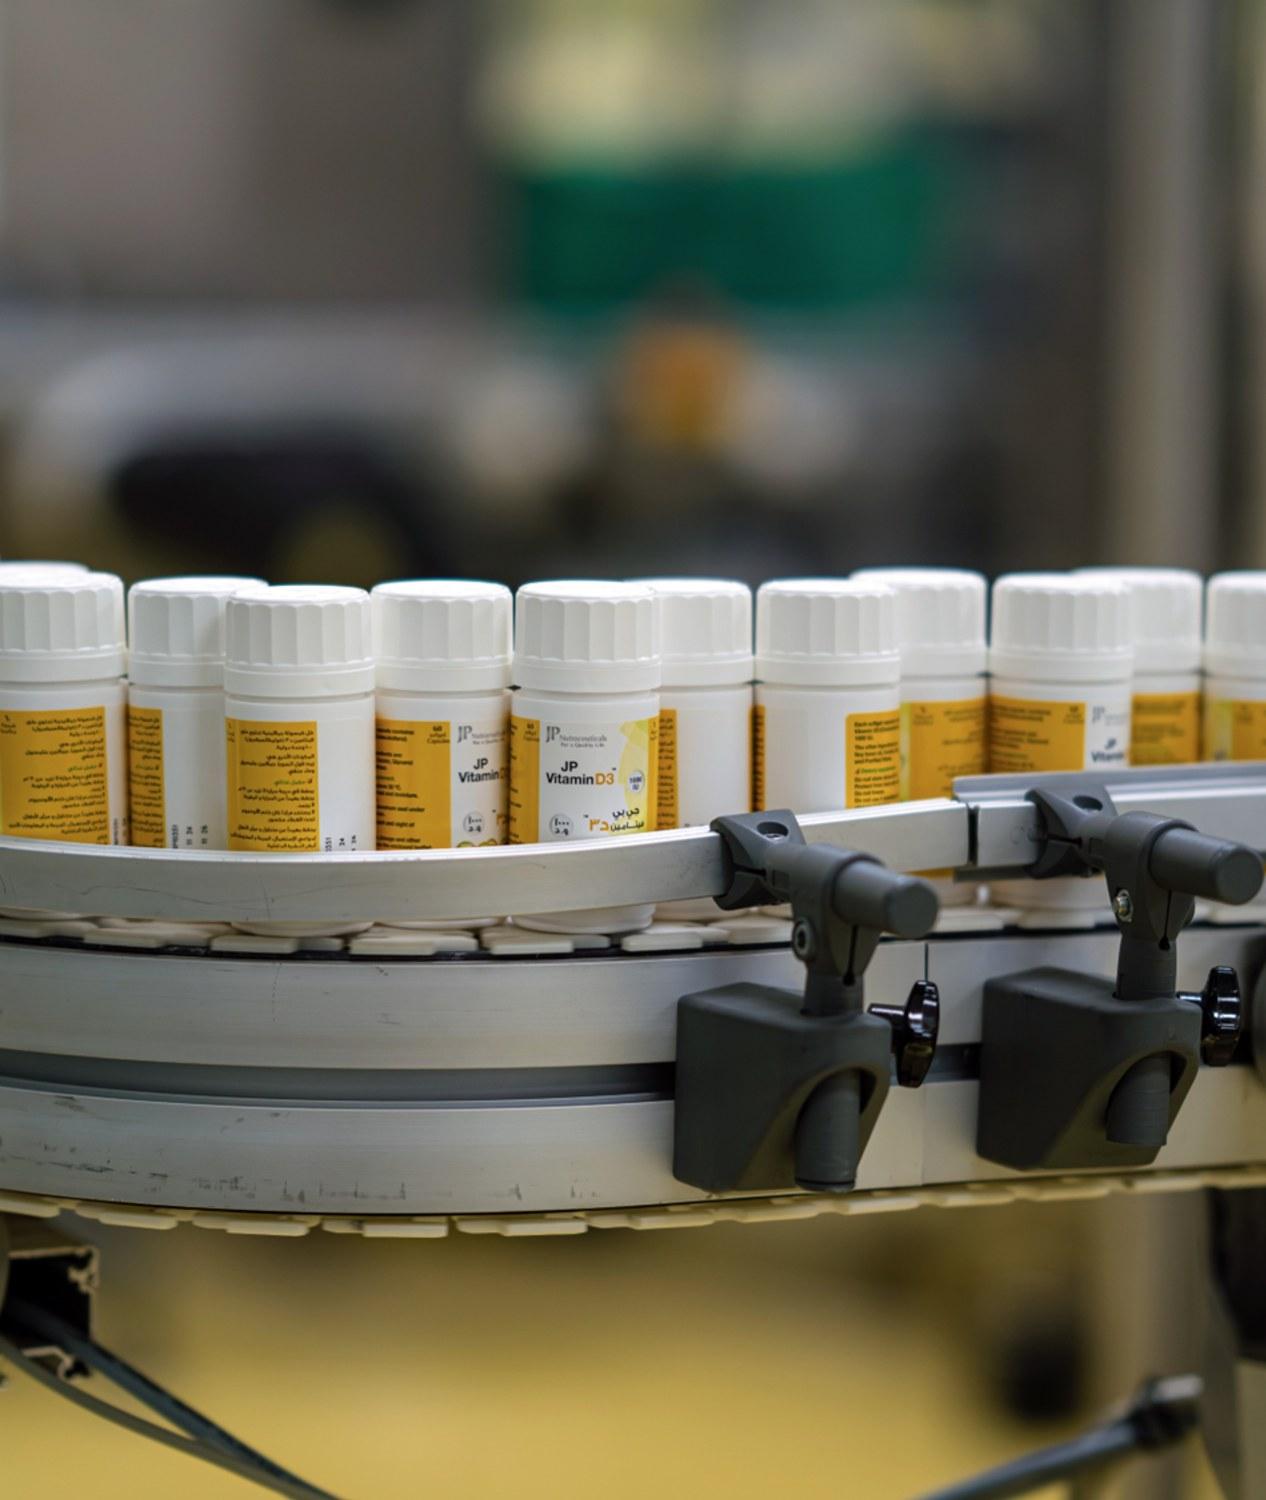
9M 2026 measures. CAPEX includes the KAEC acquisition. See source notes below.
JAMJOOM PHARMA · 9M 2026 RESULTSSCROLL TO EXPLORE ↓
01 / 05
Core Business Highlights
Financial and operational performance, growth contributions, market dynamics and second-half priorities.
04 FROM THE PRESENTATION
Delivering profitability in a tough environment and raising returns to shareholders
CORE BUSINESS HIGHLIGHTSNINE MONTHS 2026
Nine months of progress
Six measures of performance, returns and investment.
Revenue01
1,281.4 SAR mn
1,281.4SAR mn
+7.1% YoY
Growth since 9M 2023+
Trend shape from the original presentation; intermediate values are not labelled. 9M 2026: 1,281.4 SAR mn.
EBITDA02
477.0 SAR mn
477.0SAR mn
+7.2% YoY
37.2% EBITDA margin in 9M 2026.
Growth since 9M 2023+
Trend shape from the original presentation; intermediate values are not labelled. 9M 2026: 477.0 SAR mn.
Net profit03
416.1 SAR mn
416.1SAR mn
+5.1% YoY
32.5% net profit margin in 9M 2026.
Earnings per share: 5.94 SAR per share
Growth since 9M 2023+
Trend shape from the original presentation; intermediate values are not labelled. 9M 2026: 416.1 SAR mn.
Dividends paid04
4.2 SAR per share
4.2SAR per share
+21.4% YoY
CAPEX / revenue05
9.7% of revenue
9.7%of revenue
+4.9 pp YoY
9M 2026 capital expenditure includes the KAEC facility acquisition.
Units produced06
139.4 million units
139.4million units
+8.7% YoY
SOURCE NOTES
1. EBITDA = operating profit + depreciation + amortization + share of results in equity-accounted investees.
2. SAR 2.0 + SAR 2.2 interim dividends paid in 9M26, vs SAR 3.46. The comparison period is not specified on this page.
3. CAPEX as a percentage of revenue; 9M26 includes the KAEC facility acquisition.
4. Prior-period figures are from published financial statements.
05 FROM THE PRESENTATION
Growth came from all core therapeutic areas and key markets
PERFORMANCE AT A GLANCE
Revenue Contribution by Therapeutic Area, YoY
SAR mn
✳ Tap or focus a value for details
// Axis break: the upper range is magnified; zero is shown below the break.
Swipe or scroll to explore the full chart ↔
01,180.561,281.81,19641256(17)300.81,281
The reported end total differs from the sum of the displayed contributions.
Tap or focus a value for details
Overall revenue growth: +7%. Arithmetic check: the printed bridge contributions sum to 85.8, versus 85 for the printed end minus start (1,281 − 1,196), a difference of 0.8 SAR mn. The source does not explain the discrepancy.
PERFORMANCE AT A GLANCE
Revenue Contribution by Country, YoY
SAR mn
✳ Tap or focus a value for details
// Axis break: the upper range is magnified; zero is shown below the break.
Swipe or scroll to explore the full chart ↔
01,180.71,2811,196421716731,281
Tap or focus a value for details
Overall revenue growth: +7%.
PERFORMANCE AT A GLANCE
Revenue Growth Contributors¹, YoY
SAR mn
✳ Tap or focus a value for details
// Axis break: the upper range is magnified; zero is shown below the break.
Swipe or scroll to explore the full chart ↔
01,180.521,2821,1963632181,281
The reported end total differs from the sum of the displayed contributions.
Tap or focus a value for details
Overall revenue growth: +7%. ¹ Established brands: existing brands within the portfolio with less commercial focus. Strategic brands: existing brands within the portfolio with high revenues / high margins and enhanced commercial focus. NLBs: newly launched brands, launched since 2024. Arithmetic check: the printed bridge contributions sum to 86, versus 85 for the printed end minus start (1,281 − 1,196), a difference of 1 SAR mn. The source does not explain the discrepancy.
BUSINESS AND STRATEGY HIGHLIGHTS
Growth came from all core therapeutic areas and key markets.
Revenue Contribution by Therapeutic Area, YoY (SAR mn)
Therapeutic area / period
Revenue / bridge contribution (SAR mn)
YoY / label
Commentary
9M 25
1,196
—
—
Ophthalmology
41
+13%
—
Cardiometabolic
25
+22%
Fastest-growing therapeutic area, despite delays in new launches.
Primary Care
6
+1%
Growth moderated by softer out-of-pocket demand and destocking at pharmacies.
Consumer Health
(17)
-10%
Lower consumer spending and private-label pushes by pharmacies.
Arithmetic check (SAR mn): therapeutic-area contributions total 85.8, but the printed end minus start is 85 (1,281 − 1,196), a difference of 0.8. The source does not explain the discrepancy.
Arithmetic check (SAR mn): growth-contributor amounts total 86, but the printed end minus start is 85 (1,281 − 1,196), a difference of 1. The source does not explain the discrepancy.
06 FROM THE PRESENTATION
Outperforming the market in a challenging environment
PERFORMANCE AT A GLANCE
YTD (Jan–Aug 2026) — Sales growth vs prior year (PPG)
%
✳ Tap or focus a value for details
Swipe or scroll to explore the full chart ↔
05.210.4+0.3%+10.4%
Tap or focus a value for details
Footnote: Values in SAR million refer to the sales figures. Market share change vs prior year (YTD Aug 2025: 5.84%; MAT Aug 2025: 5.79%). Source: IQVIA SAPI August 2026, KSA market.
PERFORMANCE AT A GLANCE
MAT (Aug 2026) — Sales growth vs prior year (PPG)
%
✳ Tap or focus a value for details
Swipe or scroll to explore the full chart ↔
01020+5.3%+20.0%
Tap or focus a value for details
Footnote: Values in SAR million refer to the sales figures. Market share change vs prior year (YTD Aug 2025: 5.84%; MAT Aug 2025: 5.79%). Source: IQVIA SAPI August 2026, KSA market.
YTD — Jan–Aug 2026
Metric
Value
KSA market sales growth vs prior year (PPG)
+0.3%
Jamjoom Pharma sales growth vs prior year (PPG)
+10.4%
Growth gap: Jamjoom Pharma vs KSA market
+10.2pp
JP PVT sales
SAR 1,325 mn
Market PVT sales
SAR 20,487 mn
JP rank
#2
JP market share
6.47% (+63 bps)
MAT — MAT Aug 2026
Metric
Value
KSA market sales growth vs prior year (PPG)
+5.3%
Jamjoom Pharma sales growth vs prior year (PPG)
+20.0%
Growth gap: Jamjoom Pharma vs KSA market
+14.7pp
JP PVT sales
SAR 2,103 mn
Market PVT sales
SAR 31,993 mn
JP rank
#2
JP market share
6.57% (+78 bps)
Key Takeaways
Double-digit YTD growth in a flat market reinforces JP’s market share gain.
i. Weaker Private-Market Demand
Patients cut back on Consumer Health and out-of-pocket Primary Care as private-label competition grew.
ii. Pharmacy Chain Destocking
Top three chains (60%+ of our pharmacy sales in KSA) reduced inventory under liquidity pressure.
iii. Geopolitical & Fiscal Pressures
Regional instability disrupted supply chains and strained government budgets.
iv. Liquidity Constraints
Wasfaty demand rose, but slower Wasfaty collections squeezed channel liquidity and cut order flow.
v. Institutional Channel Slowdown
Tendering split from 1 framework tender into 9, new tenders lagged by 1-2 quarters, and stricter procurement now focuses on chronic and essential (emergency) medicines.
SOURCE NOTES
Values in SAR million. Market share change vs prior year (YTD Aug 2025: 5.84%; MAT Aug 2025: 5.79%). Source: IQVIA SAPI August 2026, KSA market.
The presentation labels the YTD growth gap +10.2 percentage points; the displayed +10.4% and +0.3% figures differ by 10.1 points. The source does not provide the underlying unrounded inputs.
07 FROM THE PRESENTATION
JP grew 27.5% YTD in the UAE, 15.6pp ahead of the market
PERFORMANCE AT A GLANCE
YTD Jan–Aug 2026 — Sales growth vs prior year (PPG)
%
✳ Tap or focus a value for details
Swipe or scroll to explore the full chart ↔
013.7527.5+11.9%+27.5%
Tap or focus a value for details
Jamjoom Pharma growth ahead of the UAE market: +15.6pp. All data in US dollars · Source: IQVIA August 2026 Private Data, UAE.
PERFORMANCE AT A GLANCE
MAT Aug 2026 — Sales growth vs prior year (PPG)
%
✳ Tap or focus a value for details
Swipe or scroll to explore the full chart ↔
011.322.6+13.4%+22.6%
Tap or focus a value for details
Jamjoom Pharma growth ahead of the UAE market: +9.2pp. All data in US dollars · Source: IQVIA August 2026 Private Data, UAE.
BUSINESS AND STRATEGY HIGHLIGHTS
JP grew 27.5% YTD in the UAE, 15.6pp ahead of the market
YTD — Jan–Aug 2026
Measure
Value
UAE market — Sales growth vs prior year (PPG)
+11.9%
Jamjoom Pharma — Sales growth vs prior year (PPG)
+27.5%
Jamjoom Pharma growth ahead of the UAE market
+15.6pp
JP PVT sales
USD 53.7 M
Market PVT sales
USD 3.616 B
JP rank
#18
JP market share
1.48%
MAT — MAT Aug 2026
Measure
Value
UAE market — Sales growth vs prior year (PPG)
+13.4%
Jamjoom Pharma — Sales growth vs prior year (PPG)
+22.6%
Jamjoom Pharma growth ahead of the UAE market
+9.2pp
JP PVT sales
USD 81.3 M
Market PVT sales
USD 5.436 B
JP rank
#18
JP market share
1.50%
SOURCE NOTES
All data in US dollars · Source: IQVIA August 2026 Private Data, UAE.
The displayed UAE YTD sales and market total do not reproduce the reported 1.48% share exactly; the source does not provide unrounded underlying figures.
08 FROM THE PRESENTATION
Progress on our six priorities for H2 2026
01 — Sustain market outperformance across key therapeutic areas and markets
CAGR ahead of market¹: KSA +5.0pp, UAE +3.6pp, Kuwait +16.6pp. Status per graphic: On track.
02 — KAEC acquisition
Transition completed successfully and ramp-up planned during 2027. Status per graphic: Achieved.
03 — Vaccine & Biologics JV
Detailed plans to be announced over the coming few months. Status per graphic: On track.
04 — Secure registrations of JP’s first ever biosimilars
2 products on track for Q4-26 registration; 2027 launch. Status per graphic: On track.
05 — Drive measurable returns from the refreshed organizational structure
On track. Status per graphic: On track.
06 — Accelerate digital transformation and deploy targeted AI capabilities
On track. Status per graphic: On track.
SOURCE NOTES
Graphic legend: On track; Achieved. The status shown for each priority is read from its icon using this legend.
¹Source: IQVIA MIDAS Monthly Database / IQVIA Local Audit. Value (USD-trade) CAGR, MAT August 2024 – MAT August 2026. Total market = all corporations including JP.
02 / 05THE NEXT CHAPTER
Strategic Growth Levers
Pipeline, partnerships and manufacturing capacity.
JAMJOOM PHARMA · 9M 2026
02 / 05
Strategic Growth Levers
Explore the product pipeline, KAEC facility, vaccines and biologics alliance, and investment priorities.
10 FROM THE PRESENTATION
62 product pipeline & 27 Under-License agreements supports 7–9 new launches a year
New-product pipeline (62 Products)
Business development: signed & progressing
Hover, tap or use keyboard focus to inspect the reported details.
Bar lengths are decorative, not a numerical scale. The source does not specify how registration relates to the pipeline categories; the registered count is presented separately, not added to them. Counts in the agreement cards are shown as reported and are not summed.
PERFORMANCE AT A GLANCE
Combined pipeline by therapeutic area (in-house + signed BD agreements)
✳ Tap or focus a value for details
Tap or focus a value for details
STRATEGIC GROWTH LEVERS
7–9 new launches/year planned over the next five years (contributing c.40–50% of revenue growth). In-house: 4–5 brands. In-licensed: 3–4 brands, including biosimilars.
New-product pipeline (62 Products)
Status
Count
Details
Under development
24
Ready for SFDA submission
16
Submitted to SFDA
22
Registered in 2026
10
6 (in-house); 4 (under-license)
Business development: signed & progressing
Measure
Count
Details
Agreements signed
27
+4 in Q3 2026
Already under SFDA review
12
Signed in 9M26
11
+4 in Q3 2026
Combined pipeline by therapeutic area (in-house + signed BD agreements)
Therapeutic area
Count
Ophtha
22
Consumer
12
CVS
8
Derma
6
GIT
6
Anti-Diabetes
5
CNS
2
GM
1
Biologics
Signed a commercial agreement with Mubadala to commercialize biosimilars in the UAE; one alone is expected to add up-to SAR 20m in commercial revenue over 5 years, with the 2nd in the pipeline to be signed. Additionally JP’s own Biologics Portfolio slated for registration & launches.
Contract Manufacturing
Pfizer portfolio impact due in Q4 2026; Viatris portfolio first order sold in September from main site (SAR 0.8m Revenue).
SOURCE NOTES
¹Other: Anti-infective (3), General Health (3), GIT / Derma / Consumer Health (3) and other BD agreements (3).
Launch numbers, revenue growth contribution and commercial service income are management estimates.
11 FROM THE PRESENTATION
KAEC acquisition adds approved capacity with an experienced team at a fraction of the cost
STRATEGIC GROWTH LEVERS
All regulatory approvals secured. 40+ employees with MNC experience.
ANNUAL CAPACITY
18M units per year, with significant available headroom.
GREENFIELD COST
~2.5× — Building a comparable new plant vs. acquiring KAEC.
Accelerated returns expected from
Q4 2027 onwards.
RAMP-UP IN THREE STEPS
Step
Activity
Description
1
Pfizer tolling volumes
Existing contract manufacturing
2
New launches
Selected new OSD products
3
Product transfers
Selected products from main site
KAEC SITE UTILIZATION
~10% → 100%. Full ramp up in 3 years as KSA OSD volumes rise from 65M to 83M units (2028–30).
LEASED LAND UTILIZATION
Currently 15% → up to 70%. Only 15% of the leased land is built up today, with scope to reach up to 70% utilization subject to approvals.
SOURCE NOTES
KAEC utilization, KSA OSD volume and site expansion figures are management estimates.
12 FROM THE PRESENTATION
Vaccines & Biologics Strategic Alliance gives JP a phased entry into vaccines and biologics
DEVELOPMENT ROADMAP
Period
Stage
Milestones
End 2026 – Q1 2027
Planning & Capital
Finalize the business plan, regulatory approval, complete site design and commence capital contribution
2027–2028
Sourcing & Registration
Agree and finalize commercial contracts for product sourcing with vaccine & biologics providers
2028–2030+
Construction to Operations
Construction starts, followed by CAPEX deployment and product sourcing. Fill & finish operations commence from 2030
Potential secondary packaging
Potential secondary packaging could bridge the gap to full operations
STRATEGIC GROWTH LEVERS
A phased, risk-managed and Vision 2030-aligned entry into vaccine & biologics localization.
SOURCE NOTES
Indicative milestones and potential returns are subject to project development, agreements and regulatory requirements.
13 FROM THE PRESENTATION
JP is investing through the cycle to capture growth as markets recover
OUTLOOK
JP is investing through the cycle to capture growth as markets recover
READINESS — Ready to lead the recovery
Measure
Growth
5-year CAGR outside KSA in Pharma products¹
+16.2%
5-year Consumer Health CAGR²
+23.7%
KAEC facility
Acquiring an approved site adds 18M units of annual capacity, with returns expected from Q4 2027.
Main-site expansion
To improve productivity at the main site to support rising demand
Commercial & talent
Investing in a sharper commercial approach and strengthening talent across the business.
Future-ready pipeline
Pipeline products and in-license agreements, support 7–9 launches a year in key therapies
Inorganic growth
Progressing portfolio acquisitions, tolling contracts and commercial service agreements
Investing while markets are soft positions JP to capitalize as demand recovers.
SOURCE NOTES
¹ Revenue excluding KSA from FY21-LTM 9M26.
² Consumer Health CAGR from FY21-LTM 9M26; management information.
Forward-looking statements are subject to market conditions, regulatory approvals and execution of planned projects.
03 / 05PERFORMANCE & CAPITAL
Financial Highlights
Quarterly performance, costs, cash and capital allocation.
JAMJOOM PHARMA · 9M 2026
03 / 05
Financial Highlights
Quarterly figures are distinct from nine-month results. Definitions, reporting periods and source notes are retained.
15 FROM THE PRESENTATION
3Q 2026 net profit rose 3.3%, with gross profit up 6.9%
PERFORMANCE AT A GLANCE
Revenue
SAR mn
✳ Tap or focus a value for details
Swipe or scroll to explore the full chart ↔
0177.5355342355
Tap or focus a value for details
+4% YoY growth. Growth led by KSA and Iraq.
PERFORMANCE AT A GLANCE
EBITDA
SAR mn
✳ Tap or focus a value for details
Swipe or scroll to explore the full chart ↔
065.5131124131
Tap or focus a value for details
+6% YoY growth. Outpaced revenue growth, as gross margin gains more than offset higher operating expenses. EBITDA calculation = Operating Profit add depreciation, add amortization, add share of results in equity-accounted investee.
PERFORMANCE AT A GLANCE
Gross Profit
SAR mn
✳ Tap or focus a value for details
Swipe or scroll to explore the full chart ↔
0111.5223209223
Tap or focus a value for details
+7% YoY growth (slide headline: 6.9%). Gross margin expanded on a more favorable product mix.
PERFORMANCE AT A GLANCE
Net Profit
SAR mn
✳ Tap or focus a value for details
Swipe or scroll to explore the full chart ↔
055110107110
Tap or focus a value for details
+3% YoY growth (slide headline: 3.3%). Grew in line with revenue, with net margin broadly stable.
Financial highlights
Metric (SAR mn)
3Q 25
3Q 26
YoY growth
Margin
3Q 25 margin
3Q 26 margin
Revenue
342
355
+4%
—
—
—
EBITDA
124
131
+6%
EBITDA Margin
36.3%
37.1%
Gross Profit
209
223
+7%
Gross Margin
60.9%
62.8%
Net Profit
107
110
+3%
Net Profit Margin
31.2%
31.1%
Revenue
Growth led by KSA and Iraq.
EBITDA
Outpaced revenue growth, as gross margin gains more than offset higher operating expenses.
Gross Profit
Gross margin expanded on a more favorable product mix.
Net Profit
Grew in line with revenue, with net margin broadly stable.
SOURCE NOTES
EBITDA calculation = Operating Profit add depreciation, add amortization, add share of results in equity-accounted investee.
The presentation displays whole-million bars alongside separately reported growth rates and margins. Some rates cannot be reproduced exactly from those displayed amounts; underlying precision is not provided.
16 FROM THE PRESENTATION
Cost of revenue rose only 2% as raw material savings offset mix and plant costs
PERFORMANCE AT A GLANCE
Total Cost Of Revenue Movement YoY
SAR mn
✳ Tap or focus a value for details
// Axis break: the upper range is magnified; zero is shown below the break.
Swipe or scroll to explore the full chart ↔
0433.37454444(7)1232454
Tap or focus a value for details
Higher manpower (salaries +14%) and depreciation from new capitalizations & leases (D&A +13%) added cost, while raw material efficiencies (-3%) from a mix weighted toward strategic brands offset most of it, holding cost growth to 2.4% against 7.1% revenue growth. JP was shielded from the immediate impact of supply delays; rising input costs and slower arrival of supplies are expected to weigh on cost in coming quarters. ¹Others: travel & communication, supplies & consumables, utilities, repair & maintenance. Raw materials include provision for inventories.
PERFORMANCE AT A GLANCE
Direct Production Cost Per Unit Sold
SAR
✳ Tap or focus a value for details
Swipe or scroll to explore the full chart ↔
01.653.33.23.33.1
Tap or focus a value for details
Unit cost declined by SAR 0.2, driven by a continued favorable mix shift and economies of scale from higher production volumes. Rising input costs and supply delays are expected to pressure unit cost in coming quarters. Unit cost: management information (unaudited).
PERFORMANCE AT A GLANCE
Operating Expenses Movement YoY
SAR mn
✳ Tap or focus a value for details
// Axis break: the upper range is magnified; zero is shown below the break.
Swipe or scroll to explore the full chart ↔
0341.363983503810(3)395
Tap or focus a value for details
OPEX rose 13% as gross margin gains were reinvested in commercial expansion (S&D +14%). R&D fell 12% as qualifying development costs were capitalized.
Total Cost Of Revenue Movement YoY (SAR mn)
Period or component
Total or movement (SAR mn)
YoY change
9M 25
444
—
Raw materials & consumables
(7)
-3%
Salaries & employee related costs
12
+14%
D&A
3
+13%
Others
2
+5%
9M 26
454
+2% overall
Cost of revenue commentary
Higher manpower (salaries +14%) and depreciation from new capitalizations & leases (D&A +13%) added cost, while raw material efficiencies (-3%) from a mix weighted toward strategic brands offset most of it, holding cost growth to 2.4% against 7.1% revenue growth. JP was shielded from the immediate impact of supply delays; rising input costs and slower arrival of supplies are expected to weigh on cost in coming quarters.
Direct Production Cost Per Unit Sold (SAR)
Period
Direct production cost per unit sold (SAR)
9M 24
3.2
9M 25
3.3
9M 26
3.1
Unit cost commentary
Unit cost declined by SAR 0.2, driven by a continued favorable mix shift and economies of scale from higher production volumes. Rising input costs and supply delays are expected to pressure unit cost in coming quarters.
Operating Expenses Movement YoY (SAR mn)
Period or component
Total or movement (SAR mn)
YoY change
9M 25
350
—
Selling & Distribution
38
+14%
General & Administrative
10
+17%
R&D
(3)
-12%
9M 26
395
+13% overall
Operating expenses commentary
OPEX rose 13% as gross margin gains were reinvested in commercial expansion (S&D +14%). R&D fell 12% as qualifying development costs were capitalized.
The presentation reports +2% on the cost chart and 2.4% in its commentary. The latter cannot be reproduced exactly from the displayed SAR 444 million and SAR 454 million endpoints; underlying figures are not supplied.
17 FROM THE PRESENTATION
Balancing Growth and Working Capital Efficiency
PERFORMANCE AT A GLANCE
Cash Conversion Cycle (Days)
Days
DSO and DIO are stacked above the zero baseline. DPO is shown below zero as a deduction; its displayed label is positive. 9M 25: DSO LTM 153 Days, DIO LTM 181 Days, DPO LTM 38 Days; Reported CCC 296 Days. 9M 26: DSO LTM 183 Days, DIO LTM 167 Days, DPO LTM 48 Days; Reported CCC 302 Days. Reported change: +2%.
✳ Hover, tap or focus a segment for details
DSO and DIO are stacked above the zero baseline. DPO is shown below zero as a deduction; its displayed label is positive.
Reported change +2%
0
CCC296 Days
CCC302 Days
9M 25
9M 26
DSO LTMDIO LTMDPO LTM
Hover, tap or focus a segment for details
The original chart stacks DSO and DIO above the baseline and shows DPO below the baseline as a deduction, although its labels are positive. The cash conversion cycle is labelled 296 days for 9M 25 and 302 days for 9M 26, with a +2% change. DSO = average receivables ÷ LTM net sales × 365. DIO = average inventory ÷ LTM cost of sales × 365. DPO = average adjusted trade payables (trade payables less CAPEX-related payables) ÷ LTM adjusted cost of sales × 365. Average = (opening + closing balance) ÷ 2. CCC = DSO + DIO − DPO.
PERFORMANCE AT A GLANCE
Cash Bridge, 9M 2026 (SAR mn)
SAR mn
✳ Tap or focus a value for details
Swipe or scroll to explore the full chart ↔
0283.7567.4357.6+209.8−124.2−294.0−3.3145.9
Tap or focus a value for details
Cash balance stood at SAR 146 million as of 30 September 2026, after a SAR 154 million dividend payout and acquisition of the KAEC facility in Q3 2026.
Cash Conversion Cycle (Days)
Measure
9M 25
9M 26
Cash conversion cycle
296
302
DSO LTM
153
183
DIO LTM
181
167
DPO LTM
38
48
Cash Bridge, 9M 2026 (SAR mn)
Cash bridge item
SAR mn
Opening
357.6
Operating CF
+209.8
CAPEX incl. KAEC
−124.2
Dividends
−294.0
Leases, FX & other
−3.3
Closing
145.9
Cash conversion cycle
Cash conversion cycle increased by 2.0% YoY to 302 days, compared to 296 days in 9M 2025, reflecting higher receivable days, partially offset by improved inventory and extended payable days.
Receivable days (DSO)
Receivable days (DSO) increased to 183 days (19.6% YoY), due to slower collections amid regional liquidity pressure.
Inventory days (DIO)
Inventory days (DIO) declined to 167 days (7.7% YoY), reflecting improved inventory efficiency while maintaining adequate stock levels to support demand and enhance supply-chain responsiveness.
Payable days (DPO)
Payable days (DPO) increased to 48 days, compared to 38 days in 9M 2025, representing a 26.3% YoY increase, reflecting favorable payment terms negotiated with suppliers while maintaining strong supplier relationships, partially offsetting the impact of higher receivable days on the cash conversion cycle.
Cash balance
Cash balance stood at SAR 146 million as of 30 September 2026, after a SAR 154 million dividend payout and acquisition of the KAEC facility in Q3 2026.
SOURCE NOTES
The cash conversion cycle chart labels the change between 9M 25 and 9M 26 as +2%.
DSO = average receivables ÷ LTM net sales × 365.
DIO = average inventory ÷ LTM cost of sales × 365.
DPO = average adjusted trade payables (trade payables less CAPEX-related payables) ÷ LTM adjusted cost of sales × 365.
Average = (opening + closing balance) ÷ 2. CCC = DSO + DIO − DPO.
The 9M cash bridge shows SAR 294.0 million of dividends; separate narrative refers to a SAR 154 million dividend payout. The presentation does not reconcile the periods or scope of those figures.
18 FROM THE PRESENTATION
Putting our money where it matters: five investment priorities
01 Portfolio expansion
R&D spending and licensing agreements to grow the pipeline of 62 in-house and 27 licensed agreements
02 Portfolio acquisitions
Exploring acquisitions of full product portfolios to add scale in priority therapy areas
03 Vaccines & Biologics JV
Phased investment in JP's 49% stake, with operations targeted to commence from 2030
04 KAEC ramp-up & expansion
Ramp to full utilization within 3 years, with room for +15% built-up area plus +25% greenfield
05 Expansionary CAPEX
Additional capacity improvement at the main site to support rising volumes
SOURCE NOTES
Forward-looking statements; timing and scale of investments are subject to market conditions, agreements and regulatory approvals. KAEC utilization and expansion figures are management estimates.
04 / 05
Jamjoom Earnings
The nine-month 2026 earnings presentation, dated 22 October 2026.
This presentation has been prepared solely for use as an investor presentation for Jamjoom Pharmaceuticals Factory Company (the “Company”). By attending or by reading this presentation, you agree to be bound by the following limitations. The information contained in this presentation is for background purposes only and does not purport to be comprehensive and has not been independently verified, nor does it constitute or form part of any invitation or inducement to engage in any investment activity, nor does it constitute an offer or invitation to buy or subscribe to any securities in any jurisdiction, or a recommendation in respect of buying, holding or selling any securities.
No representation or warranty, express or implied, is made as to, and no reliance should be placed by any person for any purpose on the information contained in this presentation, fairness, accuracy, completeness or correctness of the information or opinions contained in this presentation. The information in this presentation is subject to change, update, revision, verification and amendment and such information may change materially. The Company is under no obligation to update or keep current the information contained in this presentation and any opinions expressed in it are subject to change without notice.
This presentation has not been approved by any competent regulatory authority. Neither this presentation nor anything contained herein shall form the basis of, or be relied upon in connection with, any offer or commitment whatsoever in any jurisdiction. The contents of this presentation are not to be construed as legal or financial. The distribution of this presentation may be restricted by law in certain jurisdictions and persons into whose possession any document or other information referred to herein come should inform themselves about and observe any such restriction.
Any failure to comply with these restrictions may constitute a violation of the securities laws of any such jurisdiction. This presentation may include statements that are, or may be deemed to be, “forward-looking statements” with respect to the Company’s financial position, results of operations and business and certain of the Company’s plans, intentions, expectations, assumptions, goals and beliefs. The contents of this presentation have been prepared by and are the sole responsibility of the Company.
21 FROM THE PRESENTATION
Thank You
Investor Relations
IR@jamjoompharma.com
05 / 05LOOKING AHEAD
Outlook and Guidance
Management’s updated guidance for FY 2026.
JAMJOOM PHARMA · 9M 2026
05 / 05
Outlook and Guidance
Guidance applies to FY 2026 only and includes forward-looking statements subject to risks and conditions.
20 FROM THE PRESENTATION
Updated FY 2026 Guidance
OUTLOOK AND GUIDANCE
Updated Guidance (FY2026 Only). FY 2027 guidance to follow with FY 2026 results.
Updated Guidance (FY2026 Only)
Metric
Status
Guidance
Details
Revenue growth
REVISED
7–9% (FY 2026)
Revised down from the 10–12% CAGR guided for FY 2026–27. Drivers: Saudi market slowdown, channel destocking, launch timing and budget constraints.
EBITDA margin
MAINTAINED
33–35%
Unchanged from prior guidance. 37.2% margin YTD.
CAPEX / Revenue
MAINTAINED
6–9%
YTD Capex at 9.7% of revenue including the KAEC facility acquisition.
Dividend (semi-annual)
MAINTAINED
50–60% payout
50% payout paid for 1H 2026.
INVESTOR RELATIONS · 2026
Investor FAQ
Answers grounded in the nine-month 2026 earnings presentation.
01How did Jamjoom Pharma perform in the first nine months of 2026?
Revenue was SAR 1,281.4 million, up 7.1% year on year. EBITDA was SAR 477.0 million, up 7.2%, with a 37.2% margin. Net profit was SAR 416.1 million, up 5.1%, with a 32.5% net profit margin and earnings per share of SAR 5.94. The presentation defines EBITDA as operating profit plus depreciation, amortization and share of results in equity-accounted investees.
02How did the third quarter of 2026 perform?
In Q3 2026, revenue was approximately SAR 355 million, up 4% year on year. EBITDA was approximately SAR 131 million, up 6%, with a 37.1% margin. Net profit was approximately SAR 110 million, up 3.3%, with a 31.1% net profit margin. The presentation attributes revenue growth to Saudi Arabia and Iraq.
03What dividends were paid in the first nine months of 2026, and what is the FY 2026 guidance?
The presentation reports interim dividends paid during 9M 2026 of SAR 4.2 per share, comprising SAR 2.0 and SAR 2.2, versus SAR 3.46 per share. It does not specify the comparison period for the SAR 3.46 figure. FY 2026 guidance maintains a semi-annual payout of 50–60%; the presentation says a 50% payout was paid for 1H 2026.
04Which markets contributed to revenue growth in 9M 2026?
The presentation reports year-on-year revenue growth of 5% in Saudi Arabia, 11% in the Gulf, 16% in Iraq, 8% in North Africa and other export countries, and 6% in Egypt during 9M 2026. It notes that market-share gains and strategic brands supported Saudi growth despite softer private-market demand.
05How did the main therapeutic areas perform in 9M 2026?
Year on year, ophthalmology revenue grew 13%, cardiometabolic revenue 22%, primary care 1%, and dermatology 14%. Consumer health revenue fell 10%, which the presentation associates with lower consumer spending and pharmacy promotion of private-label products.
06How did Jamjoom Pharma perform in the Saudi private market through August 2026?
For January–August 2026, the presentation reports private-market sales growth of 10.4% for Jamjoom Pharma versus 0.3% for the Saudi market, compared with the prior year. The company's market share was 6.47%, up 63 basis points, and it ranked second. The presentation also notes weaker private-market demand and inventory reductions at major pharmacy chains.
07What does the product pipeline look like, and how many launches are planned?
The presentation lists 62 products in the new-product pipeline: 24 under development, 16 ready for submission to the Saudi Food and Drug Authority (SFDA), and 22 submitted to the SFDA. It also reports 27 signed in-license agreements and 11 agreements signed in 9M 2026. Management plans 7–9 launches per year over the next five years and estimates they will contribute approximately 40–50% of revenue growth.
08What progress is planned for biosimilars, vaccines and biologics?
The presentation says two biosimilar products are on track for registration in Q4 2026 and launch in 2027. For vaccines and biologics, it outlines a phased roadmap with fill-and-finish operations commencing from 2030. These indicative milestones are subject to project development, agreements and regulatory requirements.
09What does the KAEC facility add to manufacturing capacity?
The acquired King Abdullah Economic City (KAEC) facility has annual capacity of 18 million units. The presentation says the transition was completed and ramp-up is planned during 2027, with accelerated returns expected from Q4 2027 onward. Management estimates a ramp-up from approximately 10% to full site utilization within three years. Separately, the company produced 139.4 million units in 9M 2026, up 8.7% year on year.
10How did costs and operating expenses change in 9M 2026?
Cost of revenue rose 2% year on year to approximately SAR 454 million, as raw-material efficiencies partly offset higher personnel and depreciation costs. Operating expenses rose 13% to approximately SAR 395 million, with gross-margin gains reinvested in commercial expansion. The presentation expects rising input costs and supply delays to pressure unit costs in coming quarters.
11What was the cash position and working-capital trend at the end of September 2026?
The 9M 2026 cash bridge shows a closing balance of SAR 145.9 million. It includes SAR 209.8 million of operating cash flow, SAR 124.2 million of capital expenditure including KAEC, and SAR 294.0 million in dividends. The cash conversion cycle rose to 302 days from 296 days in 9M 2025, reflecting higher receivable days partly offset by improved inventory and extended payable days.
12What is the updated outlook for FY 2026?
Management revised FY 2026 revenue growth guidance to 7–9% from its previous 10–12% compound annual growth guidance for FY 2026–27. It maintained FY 2026 EBITDA margin guidance of 33–35% and capital expenditure guidance of 6–9% of revenue. For 9M 2026, capital expenditure was 9.7% of revenue, including the KAEC acquisition. The presentation cites the Saudi market slowdown, channel destocking, launch timing and budget constraints as drivers of the revenue revision; FY 2027 guidance is to follow with FY 2026 results.
Guidance is forward-looking and actual results may differ. The original presentation remains the authoritative source for disclosures.
THE AUTHORITATIVE SOURCE
Read the complete presentation
For complete disclosures and source notes, refer to the original presentation.